INDEX
SIEM
What is SIEM ?
Crucial within the realm of computer protection, Security Information and Event Management (SIEM) encompasses the utilization of software offerings and solutions that merge the management of security data with the supervision of security events. These instruments facilitate real-time evaluations of alerts related to security, which are produced by network hardware and applications.
SIEM tools possess an extensive range of core functionalities, such as the collection and administration of log events, the capacity to examine log events and supplementary data from various sources, as well as operational features like incident handling, visual summaries, and documentation.
Employing SIEM innovations, IT personnel can detect cyberattacks at the time of or even prior to their occurrence, thereby enhancing the speed of their response during incident resolution. Consequently, SIEM plays an indispensable role in the effectiveness and ongoing supervision of a company's information security framework. It serves as the bedrock of an organization's security tactics, offering a holistic method for identifying and managing potential threats.
The evolution of SIEM
The acronym "SIEM" emerged from the collaboration of two Gartner analysts who suggested a novel security information framework that integrated two preceding technologies: Security Information Management (SIM) and Security Event Management (SEM). This proposition appeared in a 2005 Gartner paper titled "Enhance IT Security through Vulnerability Management."
First-generation SIM technology was developed upon conventional log collection management systems, allowing for extended storage, examination, and reporting of log data while incorporating logs with threat intelligence. Conversely, the second-generation SEM technology tackled security events by delivering consolidation, correlation, and notification of events from a range of security apparatuses, such as antivirus software, firewalls, Intrusion Detection Systems (IDS), in addition to events disclosed directly by authentication, SNMP traps, servers, and databases.
In the years that followed, vendors amalgamated the capabilities of SIM and SEM to devise the SIEM, leading to a fresh definition as per Gartner's investigation. This nascent technology gained widespread acceptance as it offered a comprehensive methodology for detecting and managing threats, including the ability to amass, preserve, and scrutinize logs and security events from various origins.
How it works ?
SIEM systems function by gathering data from a variety of sources, including PCs, network devices, servers, and more. This data is then standardized and consolidated to facilitate ease of analysis.
SIEM platforms employ security experts who scrutinize the data in order to identify and detect potential threats. This procedure allows businesses to locate security breaches and examine alerts, offering crucial insights into the organization's security standing.
Alerts notify Security Operations/Monitoring personnel that they must look into a (possible) security event or incident. These notifications are usually concise and inform staff of a specific attack targeting the organization's information systems. Alerts can be conveyed through multiple channels, such as emails, console pop-up messages, text messages, or phone calls to smartphones.
SIEM systems generate a vast number of alerts owing to the substantial volume of events produced for each monitored platform. It is not unusual for an hourly log of events to range from hundreds to thousands. As a result, fine-tuning the SIEM for detecting and alerting on high-risk events is crucial.
The capacity to accurately pinpoint high-risk events is what distinguishes SIEM from other network monitoring and detection tools, such as Intrusion Prevention Systems (IPS) or Intrusion Detection Systems (IDS). SIEM does not supplant the logging capabilities of these devices; rather, it operates in conjunction with them by processing and amalgamating their log data to recognize events that could potentially lead to system exploitation. By integrating data from numerous sources, SIEM solutions deliver a holistic strategy for threat detection and management.
Use Cases
This section explores key business needs and practical use cases that highlight the value and effectiveness of SIEM in real-world security operations.
Log Aggregation & Normalization
The importance of threat visibility through log consolidation offered by SIEM systems cannot be overstated. In its absence, an organization's cybersecurity holds as much value as a mere paperweight. Log consolidation entails gathering terabytes of security information from vital firewalls, confidential databases, and essential applications. This process empowers the SOC team to examine the data and discern connections, significantly improving threat visibility.
Utilizing SIEM log consolidation, the SOC team can identify and scrutinize security incidents and events throughout the organization's IT infrastructure. By centralizing and correlating information from various sources, SIEM delivers a holistic strategy for threat detection and handling. This approach allows organizations to recognize patterns, tendencies, and irregularities that could suggest potential security hazards. Consequently, SOC teams can react promptly and efficiently to security incidents, reducing the repercussions on the organization.
Threat Alerting
Having a SIEM solution that can identify and notify IT security teams about possible threats within the vast volume of collected security event data is essential. This feature is critical as it allows the IT security team to carry out swifter, more targeted investigations and respond to potential security incidents in a timely and efficient manner.
Advanced analytics and threat intelligence are employed by SIEM solutions to recognize potential threats and generate real-time alerts. When a threat is detected, the system forwards alerts to the IT security team, equipping them with the necessary details to effectively investigate and mitigate the risk. By alerting IT security teams promptly, SIEM solutions aid in minimizing the potential impact of security incidents and safeguarding the organization's vital assets.
Contextualization & Response
It is important to understand that merely generating alerts is not enough. If a SIEM solution sends alerts for every possible security event, the IT security team will soon be overwhelmed by the sheer volume of alerts, and false positives may become a frequent issue, particularly in older solutions. As a result, threat contextualization is crucial for sorting through alerts, determining the actors involved in the security event, the affected parts of the network, and the timing.
Contextualization enables IT security teams to identify genuine potential threats and act swiftly. Automated configuration processes can filter some contextualized threats, reducing the number of alerts received by the team.
An ideal SIEM solution should allow an enterprise to directly manage threats, often by stopping operations while investigations take place. This approach helps to minimize the potential impact of security incidents and protect the organization's critical assets. SIEM solutions provide context and automate threat filtering, allowing IT security teams to concentrate on genuine threats, reducing alert fatigue, and enhancing the efficiency and effectiveness of incident response.
Compliance
SIEM solutions play a significant role in compliance by assisting organizations in meeting regulatory requirements through a comprehensive approach to threat detection and management.
Regulations like PCI DSS, HIPAA, and GDPR mandate organizations to implement robust security measures, including real-time monitoring and analysis of network traffic. SIEM solutions can help organizations fulfill these requirements, enabling SOC teams to detect and respond to security incidents promptly.
Automated reporting and auditing capabilities are also provided by SIEM solutions, which are essential for compliance. These features allow organizations to produce compliance reports swiftly and accurately, ensuring that they satisfy regulatory requirements and can demonstrate compliance to auditors and regulators.
Data Flows Within a SIEM
Security Information and Event Management (SIEM) systems collect and process log data from multiple sources to support effective security monitoring and incident response.
Data Ingestion
SIEM solutions ingest logs from various data sources. Each SIEM tool offers specific capabilities to collect logs from endpoints, servers, network devices, cloud environments, and applications. This phase is known as data ingestion or data collection.
Normalization and Aggregation
Once collected, the raw data is processed and normalized to ensure compatibility with the SIEM's correlation engine. Normalization converts different log formats into a standard schema, enabling consistent analysis across data sources. Aggregation consolidates related log entries to reduce noise and improve efficiency.
Detection and Response Enablement
Normalized data is then used by Security Operations Center (SOC) teams to define detection rules, build dashboards, configure visualizations, and generate alerts or incidents. This enables timely identification of threats and supports effective incident response.
Benefits of Using a SIEM Solution
Deploying a Security Information and Event Management (SIEM) system provides significant advantages that outweigh the risks of operating without one, particularly when protecting critical assets and systems.
Centralized Visibility
Without a SIEM, IT personnel lack centralized visibility over logs and events, increasing the risk of missing critical alerts and accumulating uninvestigated incidents. SIEM platforms aggregate and correlate log data, providing a unified interface for monitoring system activity.
Improved Incident Response
A well-tuned SIEM enhances the incident response process by generating alerts based on predefined categories and thresholds. For example, repeated failed login attempts that trigger an account lockout or excessive access to malicious URLs can be detected and acted upon from a single dashboard.
Automated Detection and Intelligence
Modern SIEMs include built-in intelligence to detect events based on time-based thresholds and provide summaries and custom reports. Advanced platforms incorporate AI and machine learning to identify anomalies and behavioral deviations in real time.
Proactive Threat Mitigation
SIEM tools enable proactive detection of malicious activity, often before an actual breach occurs. Their alerting and reporting functions allow rapid response, reducing the impact and cost of potential security incidents.
Regulatory Compliance
Regulated sectors such as Banking, Finance, Insurance, and Healthcare are often required to maintain SIEM systems to meet compliance obligations. SIEMs support log collection, review, and retention, helping organizations satisfy standards like ISO and HIPAA.
Use Case Development
As we have seen before, SIEM use cases are predefined detection scenarios designed to identify specific security threats. They form a critical component of a cybersecurity strategy by enabling automated detection, alerting, and response to suspicious activities across the IT environment.
A use case defines the conditions under which a SIEM should correlate events and generate alerts. These scenarios can range from simple patterns—such as multiple failed login attempts—to complex attack chains like lateral movement or ransomware detection.
Example: Brute Force Detection
Consider a scenario where a user named Rob encounters 10 consecutive failed login attempts. These events may result from forgotten credentials or a brute-force attack. Once the SIEM correlates these events under a defined threshold and pattern, it triggers a brute-force alert to the SOC team.
Based on this alert, the SOC can initiate investigation and mitigation procedures according to internal response workflows.
SIEM Use Case Development Lifecycle
Effective SIEM use case development requires a structured lifecycle to ensure accurate detection and minimal false positives. The process includes the following stages:
1. Requirements
Define the purpose of the use case and the detection goal. Example: detect brute-force attacks by alerting on 10 failed logins within a 4-minute window. Requirements may originate from business needs, compliance obligations, or analyst input.
2. Data Points
Identify relevant log sources and user authentication vectors—such as Windows/Linux endpoints, VPNs, or cloud apps. Ensure logs include user identity, timestamp, source IP, destination host, and authentication outcome.
3. Log Validation
Verify that all necessary logs are received and parsed correctly. Validate log integrity across various authentication methods (e.g., local login, VPN, web-based). Confirm that critical fields are consistently populated.
4. Design and Implementation
Define detection logic based on three parameters:
- Condition: e.g., 10 failed logins within 4 minutes
- Aggregation: group by user/IP to prevent alert duplication
- Priority: escalate based on the affected user's privileges
5. Documentation
Create a Standard Operating Procedure (SOP) detailing alert criteria, escalation paths, and response guidelines. Include documentation on related teams, alert thresholds, and notification channels.
6. Onboarding
Before production deployment, validate the use case in a controlled environment. Adjust thresholds and aggregation settings to reduce false positives and confirm rule effectiveness.
7. Periodic Update / Fine-Tuning
Regularly refine use cases using analyst feedback, incident trends, and whitelisting. Adjust correlation rules and thresholds to reflect evolving threat patterns and business context.
Elastic Stack
What is the Elastic Stack ?
The Elastic Stack, developed by Elastic, is an open-source suite of tools designed for centralized logging, search, and real-time data analysis. It is composed of four primary components: Elasticsearch, Logstash, Kibana, and Beats.
Architecture Overview
The Elastic Stack ingests data via Beats and Logstash, processes and indexes it in Elasticsearch, and visualizes it through Kibana. Deployment options include SaaS via Elastic Cloud, self-managed through Elastic Cloud Enterprise, or standalone setups. In high-throughput environments, message brokers like Kafka and Redis can be added for buffering, with nginx serving as a reverse proxy for added security.
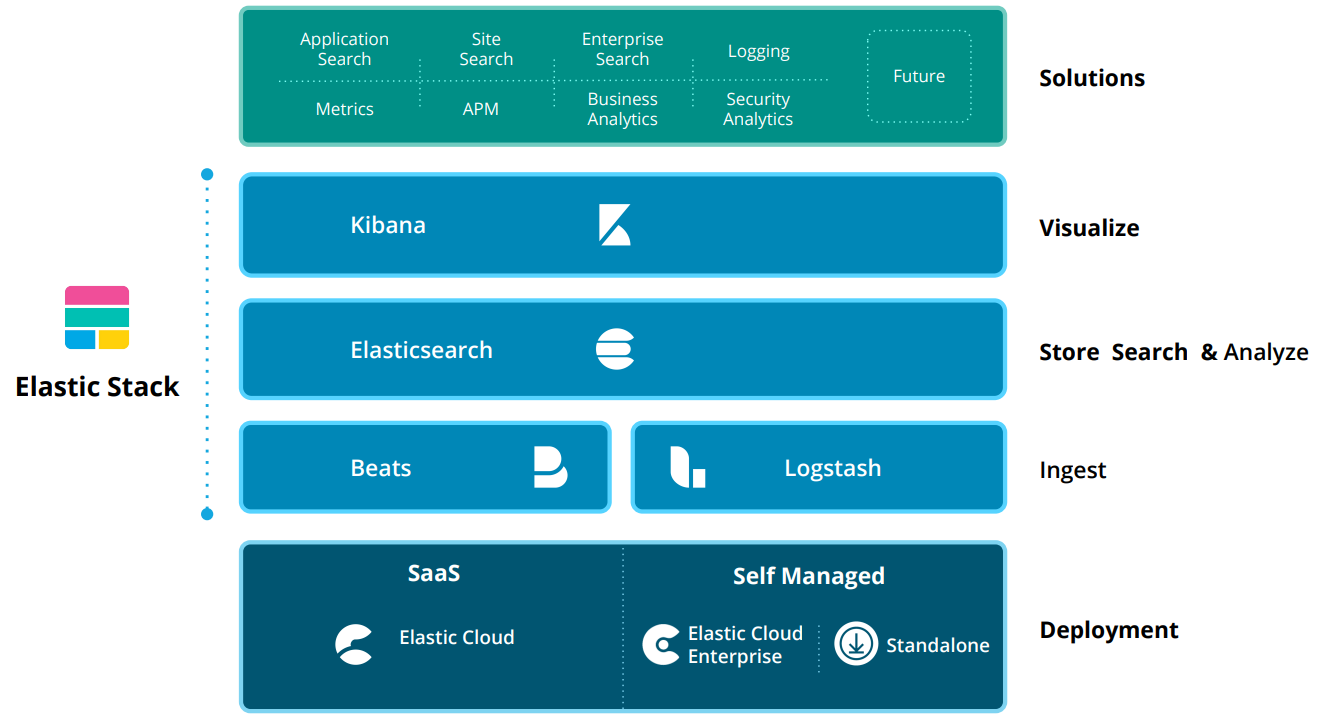
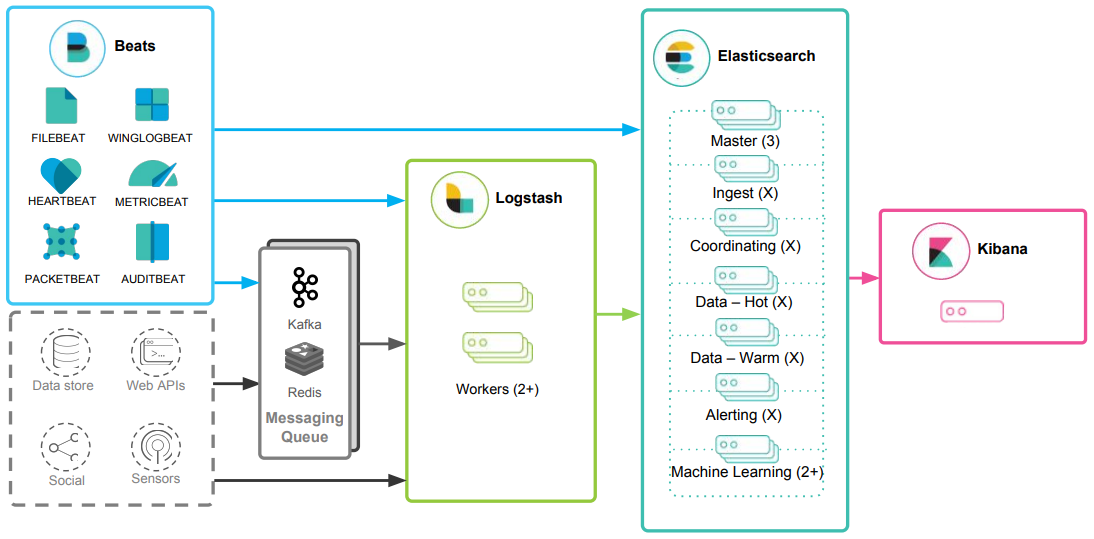
Beats
Beats are lightweight, single-purpose data shippers that collect and forward data from edge systems. Examples include Filebeat for log files and Metricbeat for metrics. Beats can send data directly to Elasticsearch or through Logstash for additional processing.
Logstash
Logstash is a data processing pipeline that ingests, transforms, and forwards data. It supports various input sources such as files, TCP, and syslog. Its filtering system enables enrichment and transformation of events. Logstash uses output plugins to transmit processed data to Elasticsearch.
Elasticsearch
Elasticsearch is a distributed search and analytics engine that stores and indexes data. Built on a RESTful interface and JSON-based structure, it provides advanced querying and analytics capabilities, acting as the core of the Elastic Stack.
Kibana
Kibana is the front-end visualization layer for data stored in Elasticsearch. It enables users to run queries, create dashboards, and visualize trends using charts, tables, and graphs. Kibana plays a crucial role in making Elasticsearch data actionable.
Elastic Stack as a SIEM Solution
The Elastic Stack can serve as a robust Security Information and Event Management (SIEM) solution to collect, store, analyze, and visualize security-related data from various sources including firewalls, IDS/IPS, and endpoints. Security data is ingested using Beats and Logstash, processed and indexed in Elasticsearch, and visualized through Kibana. Custom dashboards and search queries in Kibana enable analysts to monitor and respond to security events in real time.
Kibana Query Language (KQL)
KQL is a user-friendly query language used in Kibana for searching and analyzing data within Elasticsearch. It simplifies data exploration by allowing intuitive query building compared to Elasticsearch’s Query DSL.
Basic Field Matching
$ vent.code:46This query identifies failed login attempts on Windows systems. It helps detect brute-force attempts or other unauthorized access attempts.
Free Text Search
$ "svc-sql1"Searches across all fields for the string "svc-sql1", enabling quick identification of events related to a specific hostname, username, or process.
Logical Operators
$ event.code:4625 AND winlog.event_data.SubStatus:0xC0000072This query identifies failed logins against disabled accounts, which could indicate enumeration or exploitation attempts by an attacker.
Comparison Operators
$ event.code:4625 AND winlog.event_data.SubStatus:0xC0000072 AND @timestamp >= "2023-03-03T00:00:00.000Z" AND @timestamp <= "2023-03-06T23:59:59.999Z"Filters login failures to disabled accounts within a specific date range, aiding timeline analysis during incident investigations.
Wildcards and Regular Expressions
$ event.code:4625 AND user.name: admin*Identifies failed login attempts targeting usernames beginning with "admin", useful for detecting targeted brute-force attacks on administrator accounts.
How to Identify the Available Data
Understanding which fields and values are available is essential before crafting effective Kibana Query Language (KQL) queries. This section outlines two primary approaches: using Kibana's Discover feature and consulting Elastic's official documentation.
Approach 1: Leverage KQL Free Text Search in Discover
Kibana's Discover feature allows analysts to explore ingested data, examine field structures, and preview values before writing KQL queries. For instance, to detect failed login attempts against disabled accounts between March 3rd and March 6th, 2023, a typical KQL query would be:
$ event.code:4625 AND winlog.event_data.SubStatus:0xC0000072 AND
@timestamp >= "2023-03-03T00:00:00.000Z" AND
@timestamp <= "2023-03-06T23:59:59.999Z"
Begin by conducting a free text search for "4625". Returned records may include:
event.code— part of the Elastic Common Schema (ECS)winlog.event_id— specific to Winlogbeat@timestamp— reflects the event time, distinct fromevent.created
To identify the reason for login failure, search for "0xC0000072". This value indicates a
disabled account in the winlog.event_data.SubStatus field.
Approach 2: Consult Elastic Documentation
Elastic’s official documentation provides detailed information about available field names, formats, and usage across Beats and ECS. Reviewing documentation prior to query construction ensures better alignment with standardized field names.
Recommended references include:
Where possible, ECS field names should be used in queries to maintain consistency across teams and environments, especially in multi-department deployments.
The Elastic Common Schema (ECS)
The Elastic Common Schema (ECS) is a standardized and extensible field naming convention used across the Elastic Stack. It ensures consistency in how event data is structured, regardless of the original source.
Unified Data View
ECS enforces consistent field names across logs from diverse sources such as Windows event logs, network traffic, endpoint telemetry, and cloud environments. This unified structure enables centralized querying and analysis across all data.
Improved Search Efficiency
By eliminating the need to learn source-specific field names, ECS simplifies the creation of Kibana Query Language (KQL) searches. Analysts can write efficient and reusable queries across multiple log types using standardized field labels.
Enhanced Correlation
ECS facilitates multi-source correlation by enabling uniform reference to common attributes such as IP addresses, hostnames, or user identifiers. This improves the accuracy and speed of incident investigations.
Better Visualizations
Consistent data structure across sources improves the usability of Kibana dashboards. ECS ensures that visualizations are coherent and maintainable, aiding in anomaly detection and trend analysis.
Interoperability with Elastic Solutions
ECS provides native compatibility with Elastic Security, Observability, and Machine Learning features. This enables advanced use cases like threat hunting, behavior analytics, and infrastructure monitoring.
Future-proofing
ECS serves as the foundational schema for the Elastic Stack. Aligning with ECS ensures long-term compatibility with future product enhancements, integrations, and schema extensions within the Elastic ecosystem.
MITRE ATT&CK
What is it ?
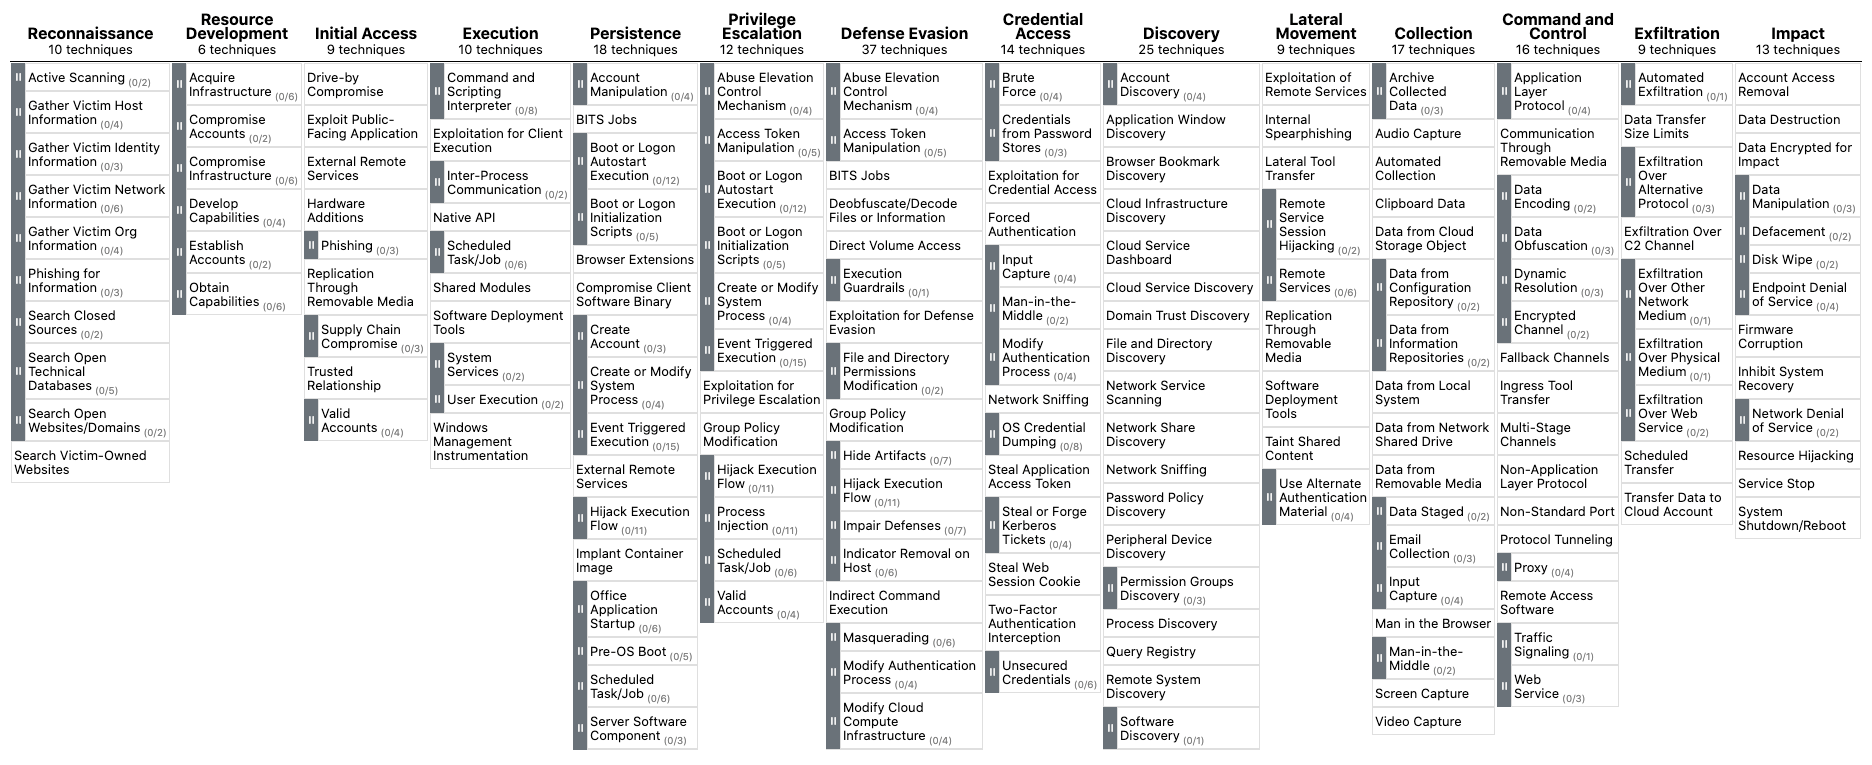
MITRE ATT&CK (Adversarial Tactics, Techniques, and Common Knowledge) is a comprehensive and continuously updated framework that documents the tactics, techniques, and procedures (TTPs) used by cyber threat actors. It provides a structured approach to threat analysis, helping defenders identify, classify, and respond to adversarial behavior.
The framework is organized into matrices corresponding to different operating environments, including enterprise, mobile, and cloud. Each matrix maps attacker tactics—representing high-level objectives such as privilege escalation or data exfiltration—to specific techniques, which describe the methods attackers use to achieve those goals.
By using ATT&CK, security teams can analyze threat actor behavior, prioritize defenses, improve detection strategies, and enhance incident response processes through a threat-informed defense model.
Use Cases
The MITRE ATT&CK framework is a strategic asset for security operations, providing actionable insights and a structured methodology for understanding and defending against adversary behavior. It supports multiple use cases across the security lifecycle.
Detection and Response
ATT&CK enables Security Operations Centers (SOCs) to build detection and response mechanisms aligned with known attacker TTPs. It helps identify gaps in visibility and enhances response playbooks based on real-world techniques.
Security Evaluation and Gap Analysis
Organizations can evaluate their defensive posture by mapping current controls against ATT&CK techniques. This process highlights unprotected attack vectors and guides security investment decisions.
SOC Maturity Assessment
ATT&CK supports the evaluation of SOC capabilities by measuring the organization's ability to detect, respond to, and mitigate specific adversarial techniques. It provides a maturity baseline and identifies areas for improvement.
Threat Intelligence
ATT&CK standardizes the representation of adversary behaviors, improving internal communication and external threat intelligence sharing. It enhances the quality and consistency of threat reports and detection logic.
Cyber Threat Intelligence Enrichment
By mapping TTPs to IOCs and attack patterns, organizations can contextualize threat data and improve decision-making. ATT&CK enriches CTI feeds with insights into likely adversary behaviors and attack objectives.
Behavioral Analytics Development
The framework aids in developing analytics that identify abnormal system and user behaviors mapped to ATT&CK techniques. This approach strengthens anomaly detection and supports proactive threat hunting.
Red Teaming and Penetration Testing
ATT&CK provides a tactical reference for simulating real-world attacker behaviors during red team and penetration testing exercises. This improves test realism and helps validate detection and response controls.
Training and Education
The structure and depth of ATT&CK make it a valuable educational tool for security practitioners. It facilitates knowledge transfer about adversary tactics and enhances the readiness of SOC personnel.
Overall, MITRE ATT&CK delivers a unified framework for describing adversarial behavior, supporting detection engineering, intelligence sharing, SOC capability assessment, and the development of a threat-informed defense strategy.
Alert Triaging & Assessment
What Is Alert Triaging ?
Alert triaging, performed by a Security Operations Center (SOC) analyst, is the process of evaluating and prioritizing security alerts generated by various monitoring and detection systems to determine their level of threat and potential impact on an organization's systems and data. It involves systematically reviewing and categorizing alerts to effectively allocate resources and respond to security incidents.
Escalation is an important aspect of alert triaging in a SOC environment. The escalation process typically involves notifying supervisors, incident response teams, or designated individuals within the organization who have the authority to make decisions and coordinate the response effort. The SOC analyst provides detailed information about the alert, including its severity, potential impact, and any relevant findings from the initial investigation. This allows the decision-makers to assess the situation and determine the appropriate course of action, such as involving specialized teams, initiating broader incident response procedures, or engaging external resources if necessary.
Escalation ensures that critical alerts receive prompt attention and facilitates effective coordination among different stakeholders, enabling a timely and efficient response to potential security incidents. It helps to leverage the expertise and decision-making capabilities of individuals who are responsible for managing and mitigating higher-level threats or incidents within the organization.
What Is The Ideal Triaging Process ?
1. Initial Alert Review
- Thoroughly review the initial alert, including metadata, timestamp, source IP, destination IP, affected systems, and triggering rule/signature.
- Analyze associated logs (network traffic, system, application) to understand the alert's context.
2. Alert Classification
- Classify the alert based on severity, impact, and urgency using the organization's predefined classification system.
3. Alert Correlation
- Cross-reference the alert with related alerts, events, or incidents to identify patterns, similarities, or potential indicators of compromise (IOCs).
- Query the SIEM or log management system to gather relevant log data.
- Leverage threat intelligence feeds to check for known attack patterns or malware signatures.
4. Enrichment of Alert Data
- Gather additional information to enrich the alert data and gain context.
- Collect network packet captures, memory dumps, or file samples associated with the alert.
- Utilize external threat intelligence sources, open-source tools, or sandboxes to analyze suspicious files, URLs, or IP addresses.
- Conduct reconnaissance of affected systems for anomalies (network connections, processes, file modifications).
5. Risk Assessment
- Evaluate the potential risk and impact to critical assets, data, or infrastructure.
- Consider the value of affected systems, sensitivity of data, compliance requirements, and regulatory implications.
- Determine likelihood of a successful attack or potential lateral movement.
6. Contextual Analysis
- Analyze the affected assets, their criticality, and the sensitivity of the data they handle.
- Evaluate existing security controls and determine if the alert suggests a failure or evasion technique.
- Assess relevant compliance requirements and regulatory implications.
7. Incident Response Planning
- Document alert details, affected systems, observed behaviors, potential IOCs, and enrichment data.
- Assign roles and responsibilities to incident response team members.
- Coordinate with other teams such as network operations, system administrators, and vendors.
8. Consultation with IT Operations
- Engage IT operations to obtain additional context about the affected systems or ongoing changes.
- Collaborate to identify possible causes for false positives or misconfigurations.
- Document all insights and information gathered during consultation.
9. Response Execution
- Determine and execute the appropriate response based on previous steps.
- If non-malicious, resolve alert accordingly without escalation.
- If concerns remain, proceed with full incident response actions.
10. Escalation
- Identify triggers for escalation, such as critical systems, ongoing attacks, or insider threats.
- Notify appropriate internal stakeholders or external authorities as needed.
- Provide a detailed alert summary, including severity, enrichment data, and risk analysis.
- Document all communication and steps taken.
11. Continuous Monitoring
- Monitor the incident response progress and provide updates to stakeholders.
- Maintain close coordination with involved teams for unified response.
12. De-escalation
- De-escalate once the situation is under control and the threat is mitigated.
- Notify relevant parties with a summary of actions and outcomes.
- Review and improve the triage process periodically to adapt to new threats and needs.
CONTACT